Solid States
A 3-D Object Plotting System
24K Cassette or 32K Disk
by Tom Hudson
24K Cassette or 32K Disk
by Tom Hudson
Most people who are familiar with the Atari personal computers will agree that their graphics are superior to any other computer in their price range. By using the Atari's high-resolution GRAPHICS 8 mode, one can produce very respectable images on the video screen. Combine this ability with Atari 1020 printer/plotter hard-copy, and you've got an excellent, low-cost graphics machine.
This article presents a program which lets you show three-dimensional objects on the screen or print them out on a 1020 plotter. You can view the objects from any angle, with true perspective. If you like, object data can be stored on cassette or disk for future use.
In order to describe any object in our three-dimensional world, we must give at least three coordinates. These coordinates are usually labeled X (length), Y (width) and Z (height). This 3-D program is no exception. When you want to show an object, you must break it down into a number of points. Each point has its own set of X, Y and Z coordinates, which tells the computer where the point is located in space.
In addition to the locations of the points, we must tell the computer how these points are connected to form the sides of the object. The final result will be a "wire-frame" graphic representation of the object (so called because the object looks like it is constructed out of thin wires strung between the individual points of the object). Figure 1 shows the wire-frame representation of a pyramid.
![[Pyramid Graphic]](solid_states2.png)
The pyramid in Figure 1 is made up of five points (labeled 1-5) and eight lines. Let's see how we find the coordinates of the points of this pyramid.
First we must draw a top view of the pyramid. A piece of graph paper is best for this. Draw two per- pendicular lines on the paper as in Figure 2. Label the horizontal line X, the vertical line Y and number the lines as shown. These will be the X and Y axes, the first two coordinates in the X-Y-Z group.
![[X-Y Graph]](solid_states3.png)
Next, draw the top view of the 3-D object and number each point where two or more lines intersect. Figure 3 shows the top view of our pyramid with its five points labeled.
![[Pyramid Top View]](solid_states4.png)
Now draw another set of axis lines and label the horizontal line X and the vertical line Z. This set of axes will be used to draw a side view of the object in order to get the height coordinate (Z) for each point. Figure 4 shows the X-Z axes with the side view of out pyramid. Note that points 2 and 5 are at the same location on the side view, as are points 3 and 4. This is because they have the same X and Z locations.
![[Pyramid Side View]](solid_states5.png)
Now that we've drawn our pyramid, we can write down the coordinates for each point. First let's find the coordinates for point 1.
To find the X coordinate, we can look at either Figure 3 or Figure 4. In either case, the X coordinate for point 1 is 0.
To find the Y coordinate, we look at Figure 3. The Y coordinate for point 1 is also 0.
To find the Z coordinate, look at Figure 4. The Z coordinate for point 1 is 5.
Repeat this procedure for the remaining four points in the pyramid and you should have a list that looks like Figure 5.
| Point # | X | Y | Z |
|---|---|---|---|
| 1 | 0 | 0 | 5 |
| 2 | 4 | 4 | 0 |
| 3 | -4 | 4 | 0 |
| 4 | -4 | -4 | 0 |
| 5 | 4 | -4 | 0 |
After defining all the points, we're ready to tell the computer how to draw the pyramid. As stated earlier, this pyramid is made up of eight lines. In order to draw each line, the computer must know which two points make up the endpoints of the line. Figure 6 shows the endpoints of the eight lines.
| Line # | From Point | To Point |
|---|---|---|
| 1 | 1 | 2 |
| 2 | 1 | 3 |
| 3 | 1 | 4 |
| 4 | 1 | 5 |
| 5 | 2 | 3 |
| 6 | 3 | 4 |
| 7 | 4 | 5 |
| 8 | 5 | 2 |
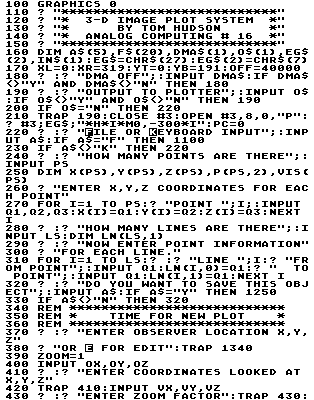
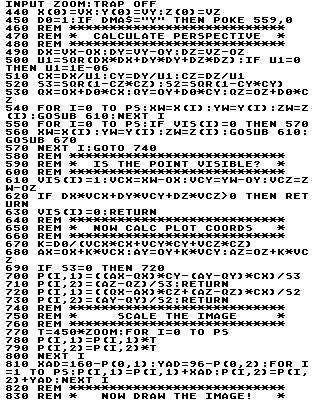
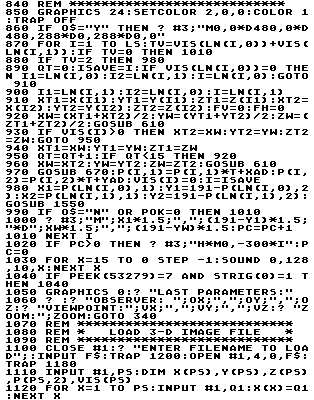
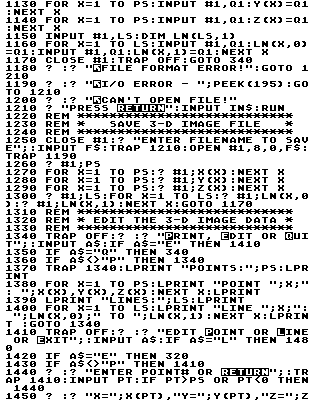
With this information in hand, you're ready to enter it into the 3-D image program in Listing 1 Type in the program and check your typing with C:CHECK or D:CHECK2. When you're sure the program is correct, RUN it.
When the 3-D object plot program is executed, the computer will ask you several questions.
Enter these point numbers as in Figure 6. Finally, you'll be asked if you'd like to save the object in a file. If you type Y, the computer will ask for a filename. For cassette, position your tape, press RECORD and PLAY, type C: and press RETURN. When the computer beeps, press RETURN again and the file will be saved. For disk, type D:FILENAME.EXT and press RETURN.
ENTER OBSERVER LOCATION X,Y,Z OR E FOR EDIT
If you'd like to examine and/or change the object data, type E, press RETURN and go to step 8. Otherwise, type in the X, Y and Z coordinates of the point in space where your imaginary "eye" is located and press RETURN. A good observer location for our pyramid is 5,7,3. Next you will be asked:
ENTER COORDINATES LOOKED AT X,Y,Z
Now you should enter the X, Y, and Z coordinates of the place where you want to look. If, for example, you want to look at the center of our pyramid, you should type 0,0,2.5 and press RETURN. Finally, you'll be asked:
ENTER ZOOM FACTOR
The normal zoom factor is 1. To enlarge the object image, type a larger number; to make the object smaller, enter a smaller number.
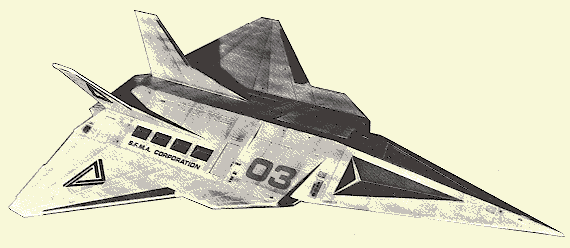
You can design and plot extremely complex objects with this image processor. The procedure is the same as the simple pyramid used in the above illustrations; there are just more points and lines involved.
Figure 7 is the data for a futuristic 3-D space shuttle. Try entering this data into your computer and viewing it.
| Points: 44 | Lines: 58 | |||||
|---|---|---|---|---|---|---|
| Point | X | Y | Z | Line | From | To |
| 1 | -5.5 | -5.5 | 0 | 1 | 7 | 6 |
| 2 | -8 | -1 | 0 | 2 | 6 | 29 |
| 3 | -8 | 3 | 0 | 3 | 29 | 7 |
| 4 | -16 | 14 | 0 | 4 | 29 | 35 |
| 5 | -16 | 17 | 0 | 5 | 35 | 36 |
| 6 | -5.5 | 21 | 0 | 6 | 36 | 37 |
| 7 | 0 | 16 | 2.5 | 7 | 37 | 38 |
| 8 | 0 | 0 | 2.5 | 8 | 38 | 28 |
| 9 | -2.5 | 0 | 1.25 | 9 | 28 | 29 |
| 10 | -2.5 | -6.5 | 1.25 | 10 | 6 | 5 |
| 11 | 0 | -7.5 | 2.5 | 11 | 5 | 4 |
| 12 | -1.25 | -2 | 1.5 | 12 | 4 | 3 |
| 13 | -1.25 | -7.5 | 1.5 | 13 | 3 | 2 |
| 14 | -2.5 | 18.5 | 1.25 | 14 | 2 | 1 |
| 15 | -4.5 | 22 | 6.5 | 15 | 1 | 6 |
| 16 | -4.5 | 18 | 6.5 | 16 | 7 | 8 |
| 17 | -3.2 | 13 | 3 | 17 | 8 | 9 |
| 18 | -2.5 | 5.5 | 1.25 | 18 | 9 | 10 |
| 19 | -4 | -6 | 0 | 19 | 10 | 1 |
| 20 | -4 | -7.5 | 0 | 20 | 8 | 26 |
| 21 | 0 | -26 | 0 | 21 | 26 | 27 |
| 22 | 4 | -7.5 | 0 | 22 | 27 | 28 |
| 23 | 4 | -6 | 0 | 23 | 30 | 31 |
| 24 | 1.25 | -7.5 | 1.5 | 24 | 31 | 32 |
| 25 | 1.25 | -2 | 1.5 | 25 | 32 | 33 |
| 26 | 2.5 | 0 | 1.25 | 26 | 33 | 34 |
| 27 | 2.5 | -6.5 | 1.25 | 27 | 34 | 30 |
| 28 | 5.5 | -5.5 | 0 | 28 | 14 | 15 |
| 29 | 5.5 | 21 | 0 | 29 | 15 | 16 |
| 30 | 2.5 | 18.5 | 1.25 | 30 | 16 | 17 |
| 31 | 4.5 | 22 | 6.5 | 31 | 17 | 18 |
| 32 | 4.5 | 18 | 6.5 | 32 | 18 | 14 |
| 33 | 3.2 | 13 | 3 | 33 | 10 | 13 |
| 34 | 2.5 | 5.5 | 1.25 | 34 | 13 | 12 |
| 35 | 16 | 17 | 0 | 35 | 12 | 9 |
| 36 | 16 | 14 | 0 | 36 | 12 | 8 |
| 37 | 8 | 3 | 0 | 37 | 13 | 11 |
| 38 | 8 | -1 | 0 | 38 | 11 | 8 |
| 39 | 3.5 | -9.5 | 0.25 | 39 | 8 | 25 |
| 40 | 0.5 | -9.5 | 2 | 40 | 25 | 26 |
| 41 | 0.5 | -19 | 0.6 | 41 | 11 | 24 |
| 42 | -0.5 | -9.5 | 2 | 42 | 24 | 25 |
| 43 | -3.5 | -9.5 | 0.25 | 43 | 27 | 24 |
| 44 | -0.5 | -19 | 0.6 | 44 | 24 | 23 |
| 45 | 23 | 22 | ||||
| 46 | 22 | 24 | ||||
| 47 | 13 | 19 | ||||
| 48 | 19 | 20 | ||||
| 49 | 20 | 13 | ||||
| 50 | 11 | 21 | ||||
| 51 | 21 | 22 | ||||
| 52 | 20 | 21 | ||||
| 53 | 42 | 43 | ||||
| 54 | 43 | 44 | ||||
| 55 | 44 | 42 | ||||
| 56 | 39 | 40 | ||||
| 57 | 40 | 41 | ||||
| 58 | 41 | 39 | ||||
Some suggested views for this shuttle are:
| Observer Loc. | Looked At | Zoom |
|---|---|---|
| 60,-60,40 | 0,0,0 | 1 |
![[Shuttle Image]](shuttle_view1.gif) | ||
| Observer Loc. | Looked At | Zoom |
| 0,-45,6 | 0,0,0 | 1 |
![[Shuttle Image]](shuttle_view2.gif) | ||
| Observer Loc. | Looked At | Zoom |
| 1,0,500 | 0,0,0 | 4.5 |
![[Shuttle Image]](shuttle_view3.gif) | ||
| Observer Loc. | Looked At | Zoom |
| 500,0,0 | 0,0,0 | 6 |
![[Shuttle Image]](shuttle_view4.gif) | ||
To be honest, I can't take all the credit for this program. I got it from a Compucolor II computer bulletin board several years ago; the author was not credited. I modified the program to work on the Atari computers, added the editing, screen clipping, plotter output and file handling.
Although the code has been heavily modified, the author may recognize the general structure, and is encouraged to let me know his or her name. I'll be glad to give credit where it is due.
I'd be interested in seeing some of the 3-D objects created by our readers with this program. just send in a printout of your object's data along with your name, and you may see your work displayed in a future issue!
100 DATA 884,171,93,680,49,183,281,21,
19,761,786,810,646,727,345,6456
250 DATA 7,361,741,555,54,975,741,76,7
36,358,140,364,580,623,747,7058
400 DATA 684,758,904,746,634,492,366,6
49,372,463,470,216,489,389,83,7715
550 DATA 868,182,868,374,466,352,181,8
44,719,364,318,370,435,571,501,7413
700 DATA 848,937,854,936,366,889,372,9
35,581,587,742,548,362,193,368,9518
850 DATA 158,523,258,560,857,273,581,7
27,815,679,764,109,918,17,713,7952
1000 DATA 873,485,698,241,637,893,973,
550,249,552,639,802,953,957,961,10463
1150 DATA 713,132,170,273,397,595,386,
551,302,553,702,526,491,494,497,6782
1300 DATA 385,553,479,555,355,614,183,
673,58,513,334,553,586,183,960,6984
1450 DATA 81,478,859,659,899,355,534,1
72,417,104,563,746,565,49,77,6558
1600 DATA 825,36,833,89,832,55,840,626
,913,636,520,958,894,177,945,9179
1750 DATA 964,922,270,808,2964