32K Disk
by Robert E. Miller
32K Disk
by Robert E. Miller
The excellent Atari 800 graphics package allows easy plotting of data on the screen, but, unfortunately, considerable labor is involved in providing titles, legends and scale values. Graph E's makes nicely formatted graphs available with a minimum of effort.
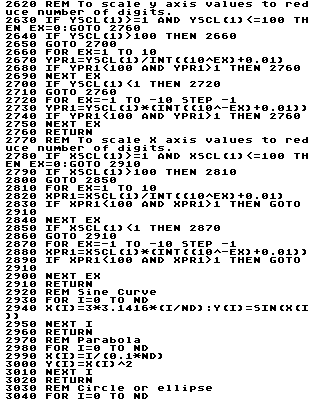
Hardcopy capability greatly enhances the utility of Graph E's. I I have provided a minimum capability for immediate demonstration purposes by incorporating the "49 Second Screen Dump" program from Compute's Second Book of Atari (Note 1). See Line 3620. Thus, as written, the screen can be dumped to an Epson MX-80 printer with Graphtrax 80 by pressing START after the graph is displayed on the screen. The resulting graph is the small size as shown in Figures 1 through 6. If you have your own screen copy utility, invoke it after the screen display is complete.
The sample plots in Figures 1 through 6 will allow you to quickly judge whether Graph E's is useful for your application. Note that these plots are available on your screen whether you have screen dump/printer capability or not.
The program as presented includes several built-in plots, so that you can try it out immediately. Once you see the action, I'm sure you will want to replace my examples with your own. The discrete point routine is especially useful, since data not represented by closed form equations can be readily handled. Explanatory remarks are included in the program listing to provide insight into the approach.
In general, curves are drawn more rapidly as the number of points is decreased, but smoother curves result from more points. In the steps beginning with Line 120, the choice of number of points, ND, is requested. As currently dimensioned, 402 points is the upper limit. 100 point curves are adequate for most purposes. Use a small ND for the first runs, to become acquainted with the program flow and screen blanking employed to speed up the program.
For the discrete point routine, ND is superceded so that it is equal to or less than the number of X-Y pairs in the associated data statement. Insert in Line 3110 the ND that is appropriate for your data. Note that sequential pairs are required if the points are to be connected as programmed. (For disconnected points on any plot, use PLOT X(J),Y(J) in Line 760.)
![[Graph E's Figure 1]](pictures/graph_es1.jpg)
![[Graph E's Figure 2]](pictures/graph_es2.jpg)
![[Graph E's Figure 3]](pictures/graph_es3.jpg)
![[Graph E's Figure 4]](pictures/graph_es4.jpg)
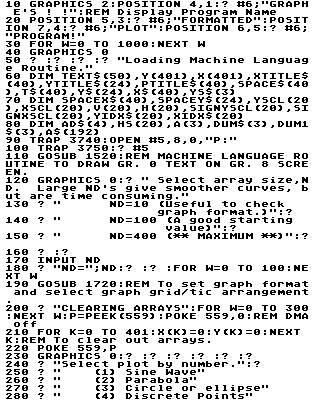
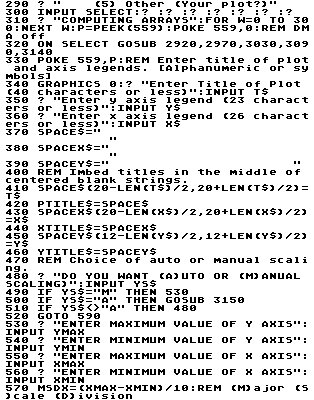
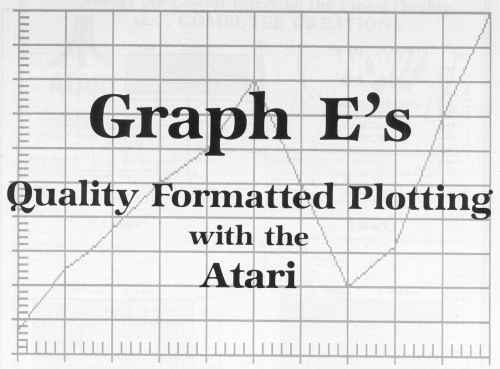
The user has a choice as to the grid, tic mark and axis arrangement. Choices 1, 2, 3 and 4 are illustrated in Figures 1 through 4, respectively. The four built-in plots 1, 2, 3 and 4 are also illustrated in these figures.
Once the grid and plot are selected, titles and legends are entered from the keyboard as prompted. Any keyboard character can be used.
Auto scaling is most useful for first pass or casual plotting. The manual feature can then be used to get the most suitable arrangement for your purposes. Figure 5 illustrates an auto scaled plot. All other figures are scaled manually.
Since the axis limits are under your control in the manual scale mode, portions of the plot can be enlarged by choosing the range of interest to be the full axis length (see Figure 6).
The scaling routines, and the method of title and legend centering, were provided by Mr. Bregoli (Note 2).
![[Graph E's Figure 5]](pictures/graph_es5.jpg)
![[Graph E's Figure 6]](pictures/graph_es6.jpg)
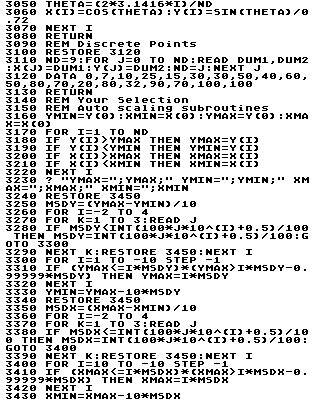
Text is obtained by drawing graphics 0 characters with the graphics 8 mode. The necessary machine language routine was presented by Mr. Crawford (Note 3) The routine is flexible and can be relocated. In fact, for this application, it was moved (in page 6), to avoid overlap with the screen dump program.
All printing on the graphics 8+16 screen is done by defining TEXT$ and its starting location, HV, which is in graphics 0 coordinates. Line 1690 calls the machine language portion loaded in subroutine 1520, through the powerful USR function.
When the graph is completed on the screen, Lines 2550 and 2600 serve to hold it, by suppressing the READY prompt until the user takes further action. To obtain a hard copy with the 49-second screen dump subroutine, press the START key. There will be a pause, followed by a printout. If no printout is required, or if the printout is complete, press the OPTION key to display the re-entry options for drawing a new graph on the screen, modifying the current one or exiting. If you have your own screen dump program, take the appropriate action while the graph is being displayed. If you do not have a printer, the program can be used to produce screen-only graphs, if program lines involving device #5 are deleted.
Several choices were necessary in order to produce consistently useful graphs. It was decided that ten major divisions, with five subdivisions, would, be used along each axis. It was also decided that only four characters would be used in the scale values, including the sign and decimal point, if present. If you don't object to encroaching on the Y-axis and overlapping more on the X-axis, the number of characters can be easily changed. One line was allowed for the title, the Y-axis legend, and the X-axis legend and scale factors. The scale factors make the limit of four characters in the scale values acceptable. However, truncation occurs in some instances until a suitable scale is selected. (Values = actual/s.f.)
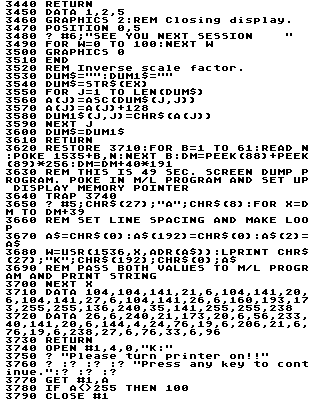
The example plots shown thus far are all small, but the Atari Epson Screen Dump II program, for example, which was purchased from Computer Age Software, Silver Springs, Maryland, will produce a printout that substantially fills an 8 1/2 x 11 page (see Figure 7). The plotting time is greater, however, especially for the 960 dots/line mode. For the most rapid plotting, one uses the 480 dots/line mode and the small plot. With the Dump II program, another option gives a white curve on a dark background.
Employment of Graph E's will allow you to produce useful graphs on your Atari with only a small expenditure of your time.
![[Graph E's Figure 7]](pictures/graph_es7.jpg)
10 DATA 350,27,508,158,49,236,278,439,
435,275,624,542,637,840,223,5621
160 DATA 240,847,64,83,154,314,875,575
,380,399,261,943,844,167,702,6848
310 DATA 785,81,654,164,181,181,426,48
9,534,6,909,629,799,938,816,7592
460 DATA 948,230,404,826,780,101,732,6
32,637,635,640,206,232,246,461,7710
610 DATA 470,487,101,755,226,559,11,71
9,959,129,246,549,1,32,20,5264
760 DATA 443,765,493,773,328,890,625,8
34,900,683,231,846,768,826,131,9536
910 DATA 668,203,328,264,849,620,522,9
88,184,348,294,642,840,547,277,7574
1060 DATA 582,816,349,0,687,853,964,49
3,501,946,197,969,662,345,986,9350
1210 DATA 292,454,94,209,951,357,371,3
0,720,14,285,302,205,849,554,5687
1360 DATA 284,591,701,213,33,212,15,69
9,864,976,505,35,958,204,974,7264
1510 DATA 733,942,520,189,616,400,351,
507,61,797,732,244,529,8,520,7149
1660 DATA 146,454,338,238,815,801,82,6
46,150,763,888,164,808,913,526,7732
1810 DATA 29,907,706,159,107,202,186,1
24,732,261,103,228,283,120,811,4958
1960 DATA 96,536,39,917,268,404,82,177
,161,99,707,381,85,210,258,4420
2110 DATA 95,786,976,511,14,892,278,41
4,92,180,441,102,710,384,88,5963
2260 DATA 213,406,105,796,231,514,252,
895,281,624,95,190,451,112,713,5878
2410 DATA 104,91,216,409,108,799,134,5
56,947,9,502,736,62,177,398,5248
2560 DATA 553,439,389,710,53,263,430,8
69,314,731,619,355,832,744,286,7587
2710 DATA 742,666,519,831,743,808,372,
876,313,743,620,352,336,745,310,8976
2860 DATA 742,674,523,342,744,809,313,
468,907,518,814,827,473,322,269,8745
3010 DATA 489,785,475,444,64,133,495,7
91,343,180,374,947,789,996,57,7362
3160 DATA 755,451,213,210,200,197,496,
144,196,255,274,109,826,439,310,5075
3310 DATA 628,499,341,199,253,277,112,
338,442,582,618,502,338,799,868,6796
3460 DATA 867,233,507,386,61,273,176,5
77,530,476,42,201,35,515,67,4946
3610 DATA 802,955,239,706,617,326,606,
116,963,554,576,662,807,471,445,8845
3760 DATA 576,863,691,887,3017