|
Kuma
£39.95
|
 |
K-Graph is the latest addition to the K series of
business applications for the ST and can be used on its own or in
conjunction with K-Spread to produce graphs of many different sorts
and styles. Whilst K-Spread itself does not match the power of VIP,
K-Graph stands comparison much better. Indeed, in its range and ease
of use it surpasses the graphing capabilities of that package.
As a stand alone package, data is entered and
saved as a series of data sets using GEM to add or edit various
items of data. Each set can be named and saved to disk for future
use. Really that is all there is to creating the data for your
graphs, it couldn't be simpler.
Displaying a graph involves load the appropriate
data set or sets into memory for use as required later. Up to 32
data sets can reside in memory at any one time and up to 20 sets can
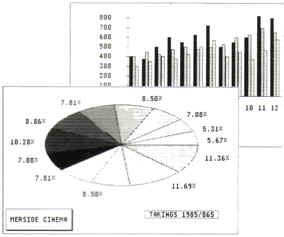
be displayed on one graph. There is a wide range of graph types -
Line, Vertical Bar, Horizontal Bar, Stacked Bar, 3D Bar, Pie and
Overlaid Bar. The manual also mentions Scatter Graphs but this does
not appear on the drop down menu. To display a graph you simply
choose the type and then click on a Menu option called Display Set.
This allows you to choose which set will be shown on the graph. A
further option is then displayed giving you the choice of shading or
colour used for that data. The graph itself is then instantly shown.
Further data sets can be added to a graph at any time by selecting
Display Set again and choosing the appropriate data set. Changing
the style of graph is easy, simply click on change and choose the
appropriate type. It is drawn instantly. One disadvantage of
changing graph types is that you are not given the opportunity to
select the shading or colour which is used for display. To do this
you must recreate the graph anew which, admittedly, takes only a few
seconds for a single set of data but could prove cumbersome for more
complex graphs. Another nuisance on changing is that you cannot
return to a pie graph when you have selected another, you have to
recreate. This seems to be a bug associated with the restriction
that you cannot use multiple data sets on a pie graph.
Titles can be added to any graph as can a line of
text, these appear in 3-D style 'stand out' boxes and can be
positioned anywhere on the graph simply by moving them with the
mouse. Indeed the whole graph can be moved in this way to give you
more creative freedom. The text can be 'arrowed' to point at any
particular part of a graph. X and Y axes can of course be labelled
as you wish. These labels can be created at will bur must be saved
separately from the data sets which is a nuisance. The manual says
that Data and Labels can be saved together but does not tell you
how, at least I couldn't figure it out.
The patterns used for lines and fills can be
edited and saved to disk giving a wide choice of presentation style.
In addition the whole of a created graph can be saved to disk in
DEGAS format for later enhancement with that or other packages. The
Print option is excellent allowing a wide choice of paper size and
giving the user the opportunity to select exactly the position that
the graph appears on the paper. Certain control is possible over the
size of the image. One drawback is that printing is only possible on
an Epson compatible printer, a strange restriction since Kuma were
the first to provide printer alternatives on a spreadsheet.
There are several other options and refinements
possible which can add to the finished style of graph you produce.
Additionally data can be transferred from K-Spread but I was unable
to test this as it only works with version 1.24 or higher of
K-Spread.
Overall the program is excellent but does have
some drawbacks. One is that, apart from dumping the screen in DEGAS
format, you do not appear to be able to save a graph complete with
labels, titles and text. A real nuisance if you have spent some time
in getting things just right. The criticisms are really minor though
and the program is a joy to use. It will add punch to any
presentation you may require for your statistics and the ability to
save in DEGAS format means that you will be able to use animation
packages like Make It Move to produce the most stunning business
presentations that your colleagues or friends have seen!
top