This is the third part of
this series which looks at the use of the ST's GEM interface from C.
In it we shall take a third (and for the moment final) look at the
graphics functions available from GEM and add another demonstration
to the program we have been developing.
The accompanying listing is for the fourth demo. You
will see that there are two additional global declarations for
functions returning WORDs and a few lines added to main() to allow
the new demo to be called. Once you have got this typed in and
successfully compiled, pressing any key (other than the space bar)
at the end of the third demo will call the function demo4(). To exit
this demo, press either mouse button to rerun the whole program, or
both buttons together to exit back to the desktop.
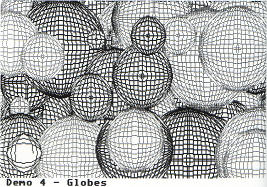
DEMONSTRATION 4
The purpose of this demonstration is to draw a series
of 'wireframe' globes having a 3D effect. To make things more
interesting the globes will be of different sizes scattered randomly
over the screen. It starts off with the declaration and
initialisation of some auto variables. The variables color and
max_color limit the colors used in drawing the globes, so that only
the color indices 2 to 7 inclusive are used. This is solely out of
personal preference, and you can use the full range of colours (1 to
15) if you wish. Variables max_rad, high_x and high_y impose limits
on the size and position of the globes and again can be changed if
you wish.
The
next five lines should be familiar by now as we have used these
functions before. The function vsLcolor() is one of the attribute
functions, and sets line (as opposed to text or fill) colour. It has
the same parameters as the related functions vst_color() or
vsf_color(). The next group of lines use a function we have not met
so far. The problem with this demonstration is that we don't know
exactly where a globe is going to be drawn, since we are using
random numbers to determine size and position. The result is that a
globe drawn near (for example) the left or right edge of the screen
might 'spill over' the edge. In this case part of the globe will be
drawn on the opposite side of the screen, which doesn't look very
impressive. Alternatively a globe at the bottom of the screen would
overwrite the title of the demo. We could get round this by ensuring
that the positioning of the globes was such that they could never
approach the edge, but then they would tend to all be concentrated
in the centre of the screen. What is needed then is a method of
restricting – or clipping –graphic output to a defined area of the
screen. It won't come as a surprise to find that GEM provides
exactly that facility.
The function vs_clip() sets up a graphic clipping
rectangle. It is called with the following parameters:
vs_clip( device handle, clipping flag, rectangle
coordinates array )
The coordinates array is an array of four sixteen-bit
words. The first two words contain the x and y coordinates of the
upper left corner of the clipping rectangle, while the second two
words contain the coordinates of the diagonally opposite corner.
When the function is called, it will restrict graphics output to
within this defined rectangle. The clipping flag simply indicates if
clipping is enabled or disabled. If it has the value 1, clipping is
enabled; if 0, clipping is disabled. Note that on first opening a
virtual workstation clipping is disabled. The clipping rectangle
used in this demo uses the whole screen except for 10 pixels at the
bottom, which is where the title is printed.
We now enter the main loop of the function. Each pass
through the while loop draws another globe, then checks to see if
the user has pressed one of the mouse buttons. If a button has been
pressed, the while loop is terminated and the function waits in
another loop until the button is released again. It then disables
the clipping rectangle in case it interferes with the output of one
of the other demos and finally returns the number of the button(s)
pressed to main().
THE
MAIN LOOP OF THE DEMO
This is straightforward. Each pass through the loop,
the size of the globe and its position on the screen is determined
by three calls to calc_num(), discussed further below. The fill
colour is then set to zero (background colour) and the function
v_ellipse() is called, which draws a filled ellipse on the screen.
Since the fill colour is the background colour, the result is to
clear an area of the screen where the next globe is going to be
drawn. If this isn't done, the new globe overwrites the old one
which tends to look a bit of a mess. In fact, if I remember my
geometry correctly, what v_ellipse() draws is not an ellipse (a
shape which has two centres, not one as a circle does) but an oval,
which can be thought of as a circle which has different radii in the
x and y planes. Be that as it may, the function is called with these
parameters:
v_ellipse( device handle, centre x coordinate, centre y coordinate,
x radius, y radius )
As indicated above, this function uses fill
attributes. Clearly, if the x and y radii are the same you get a
circle — or do you? The answer is that you do in low resolution (and
probably also in high resolution, though I haven't been able to try
it) but definitely not in medium resolution. You may have been
wondering why we aren't using v_circle() for this purpose if we want
to draw a circle. I originally wrote this demo as a stand alone
version to run in any resolution, and I found that in medium
resolution v_circle() didn't clear the correct area for the new
globe. This is due to the shape of the pixels which are more or less
square in low and high resolutions but are significantly taller than
they are wide in medium resolution. If you use v_ellipse() with
identical x and y radii in this mode you get a pronounced oval, not
a circle. The people who implemented GEM for the ST must have
realised this problem with medium resolution, and ensured that
v_circle() would draw a true circle, not an oval. Consequently,
v_circle() does not clear a sufficient screen area in this mode and
v_ellipse() must be used instead. Although this demo is intended for
use in low resolution, I have left it as v_ellipse() in case you
want to try converting the demo to run in other resolutions.
Having cleared the way for the new globe, the line
colour is set to the current value in the variable color and
temp_radius is initialised. The function v_ellarc() is then called
to draw the outline of the new globe. This function is analogous to
v_ellipse() except that it uses line rather than fill attributes,
and is supplied with two extra parameters to enable part of an
ellipse (i.e. an elliptical arc) to be drawn if desired. These two
parameters (starta and stopa in this program) are the beginning and
end angles for the arc, and are expressed in tenths of a degree. By
setting them to 0 and 3600 respectively, we get a complete circle
(this is similar to v_pieslice() which we used in the first demo in
this series). There is of course a similar function which uses fill
rather than line attributes; this is v_ellpie() which has exactly
the same parameters as v_ellarc().
We now enter a second while loop in which the
interior lines of the globe are drawn. Function v_ellarc() is called
twice each pass through the loop to draw a series of ovals with
steadily decreasing radii in both the x and y planes. It is this
which gives the wireframe 3D appearance. The loop terminates when
temp_radius becomes zero or less than zero. The value of color is
then incremented, and if it exceeds max_color is reset to 2.
USING RANDOM NUMBERS
It only remains to discuss the workings of the
function calc_num().
Two parameters are passed to the function, which are
the minimum and maximum values of the random number to be returned.
To generate the random number I have used the function rand() which
is part of the ANSI standard for C and therefore should be part of
the standard function library in all compilers. It returns a random
number in the range zero to the maximum positive integer value for
the compiler. This is an important concept, since it means that with
Lattice C (used to write this program) which uses 32 bit integers
the range of numbers returned by rand() will be 0 to 2,147,483,647 -
hence vaLmax is set to this figure. If you use a compiler which uses
16 bit integers, you should change this figure to the maximum
positive integer value obtainable, which is 32,767.
If we divide the number returned by the call to
rand() by the maximum positive integer value, we obtain a number in
the range 0 to 1. This number must be a floating point number,
otherwise the decimal part will be discarded. Therefore vaLtemp and
vaLmax are declared as doubles. Multiplying this figure by the upper
limit and adding the lower limit gives us a figure in the range we
want. Since this is still a double, it is cast to a WORD before
returning it to the calling function.
I don't claim this is the best way of generating
random numbers, but it works for this program. If you use it in
other programs, one thing to beware of is that the maximum value
returned by calc_num() is not the upper limit you pass to it, but
the upper limit plus the lower limit value. You may need to adjust
the upper limit parameter accordingly.
LOOKING AHEAD
In these three articles we have now looked at a
reasonable selection of the graphics functions available from GEM.
Other than the number and variety of different functions there is
nothing particularly remarkable about any of them - though the
GEMinterface does make them easy to use. In the next article in this
series, we should start to look at those functions which make GEM
really stand out, namely the construction and use of windows, menus
and dialogues.
 Source Code Listing
top