Kuma
£49.95
Here's another of the K Series of application
packages from Kuma, this one providing your ST with comprehensive
business graphics and statistical analysis capability. Now in its Mk
II version, it offers graphs and charts to suit most uses. It is GEM
based and easy to use, so at last you have a simple way to turn all
that boring numeric data into something a little more digestible.
Like other members of the K Series, K-GRAPH comes in
the obligatory flimsy packaging, containing a single sided disk and
slim, tutorial style instruction booklet. I found the booklet to be
one of Kuma's better efforts, but for the price it could (should?)
be a lot better.
K-GRAPH uses the standard Kuma installation procedure
to produce a working copy from the supplied master disk. On a single
drive system this requires about 30 disk swaps to complete – not as
ridiculous as some of Kuma's other offerings, but irksome
nevertheless.
MASSIVE CAPACITY
The program produces graphs and charts from data
provided either by existing data files from programs such as
K-SPREAD or by keying it in through K-GRAPH's data editor. The usual
data editing facilities are provided, so you can easily add, delete
and change sets of data to be charted. Up to 20 data sets can be
displayed on any one chart, and up to 80 across all chart types at
any one time. A maximum of around 30000 data points can be held in
memory on a 512K machine –so this is no toy program! In practice,
though, charts get very messy with more than about six data sets
displayed, so you'd probably never push the program to its
theoretical capacity.
Data points can also be generated from a formula
supplied by you, and K-GRAPH has a set of 18 built-in arithmetic and
trigonometric functions for this purpose, together with conditional
processing facilities. You just define the formula, provide the
range and increment for X values, and K-GRAPH does the rest, at
least, that's the theory – I had a lot of trouble getting it to
work. I found the program's error messages unhelpful, and the
instruction booklet inscrutable in this area. Kuma should have
included a better explanation of the syntactical rules and practical
examples to make this feature more easily usable.
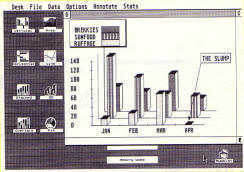
A wide range of chart types can be produced from your
data, such as line and scatter graphs, area charts, vertical and
horizontal plain bar charts, stacked, overlaid, or three dimensional
bar charts, and pie charts. You can flip at will between different
chart types for a given set of data, this being as simple as
clicking on the appropriate icon. Couldn't be easier.
CHART CUSTOMISATION
Up to four windows can be open at any time, each
displaying a different chart. Size and position of a chart within
its window is easily changed under mouse control, and you can design
your own graph line styles and fill patterns in terms of pixel
layout and colour. Point markers may also be used on line graphs,
there being a selection of shapes available for this purpose. They
can be used without the connecting graph line, and in fact this is
how you produce a scatter graph – it's really a line graph without
the lines!
Scale points on the X-axis may be individually
labelled, permitting the use of non-numeric items such as dates,
month names and the like and there is also a general annotation
feature which lets you place text anywhere on the graph in a variety
of font styles and sizes. You can draw an arrowed line 7 connecting
the text with any part of the chart to highlight something of
special interest. The text block can be moved at any time, too, and
if it has an arrow attached, the line I 'rubber-bands' so the head
of the arrow remains pointing where it should as you reposition the
text. Very neat.
A legend box showing which line or fill pattern
represents which data is automatically generated for you. This is
based on the names you give to the sets of data, and the lines/fill
patterns you defined for use in plotting them. Again, this can be
placed anywhere on the chart and can be repositioned at any time
without damaging the underlying graphics. By clicking on one of the
legends, you are cleverly taken straight into edit mode for the data
it represents.
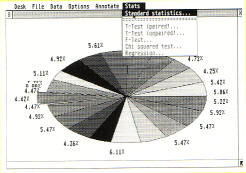
Further options allow you to overlay a grid on the
two dimensional charts, to change X and Y origins for certain types
of chart, and to choose whether pie charts display percentages or
absolute data values against each slice. You can also choose to
slide out any one slice to highlight it, although a bug in the
review copy made this feature unusable.
If all this isn't enough, you can even save a K-GRAPH
chart in DEGAS format and use that package to customise it even
more. The possibilities seem endless!
HARD COPY FACILITY
When you've got the chart looking exactly as you want
it, you can print it out upright or sideways, and enlarged and/or
centralised in the X, Y or both directions. K-Graph displays a
representation of the printed page, with a shaded area showing where
your chart will print using the current settings. You can even slide
the shaded area around using the mouse, for fine positioning.
It's designed to work with Epson printers.
Unfortunately, there seemed to be a problem using it with my Star
SG10 Epson compatible, as yet unsolved. I got round it by
transferring the file to DEGAS and printed it perfectly from there.
One annoying feature I discovered with printing is
that if you accidentally initiate it and you don't have a printer
connected, the whole system locks up. The only way out is to reset
and reload the program.
K-GRAPH can save data, labels, lines and patterns
separately, allowing the flexibility of re-using existing patterns
and labels in other charts. This can be done at any time – even when
a chart is being displayed. Alternatively, you can choose to save
data and labels together, or everything for the complete chart.
If needed, there are also a set of statistical functions, which work
on a given set of data. These include mean, standard error, median,
upper and lower quartiles, variance, standard deviation, sum of
squares, skewness, and kurtosis. And how about the coefficient of
variation and quartile coefficient of dispersion, for good measure?
Then there are other functions, such as maximum, minimum, and count
of data items, and slope and intercept of the line of least squares
best fit based on the data points provided. The coefficient of
correlation of data points to this line is also calculated.
Other functions require more than one set of data
samples, and include paired and unpaired T-tests, F-test,
Chi-Squared test, and regression analysis. I personally don't have
much use for this sort of thing, but I'm sure there are people out
there who use it all the time!
IN PRACTICE....
K-GRAPH works well, apart from the niggles mentioned
earlier. If you need a general graphing, charting and statistical
package for your ST, and can live with these problems, then go ahead
and buy K-GRAPH. It's rather expensive purely for casual home use,
but could be of great practical value for business, professional or
educational applications. I enjoyed using it, and will continue to
do so. What more can I say?
top